

Introduction
A recent trip to meet manufacturers, developers, operators across Detroit and New York revealed that the largest US corporates are quietly operationalising sustainability.
Public-facing narrative on sustainability has gone quiet. But inside the leading corporates, sustainability metrics have moved from being reporting outputs to table stakes operational inputs.
Conversations pointed to five recurring themes:
- ESG data now needs to be a core business intelligence capability
- The focus has changed from cost-centres to value-creation
- Leading teams are systematically connecting carbon to cash
- The constraint is data infrastructure
- The early movers win
1. Sustainability now needs to be a core business intelligence capability
Across conversations, we found that sustainability data has moved from being a reporting overlay, owned by CSR teams, to an operational input considered from the plant floor to the office of the CFO.
Sustainability metrics are being used to inform procurement, production, and delivery decisions - and they’re shaping financial outcomes.
Take the example of a large automotive OEM. Historically, its procurement team reviewed suppliers on three core variables: unit cost, lead time, and quality rejection rate - among others. When comparing steel from two top suppliers, the traditional metrics are nearly identical: within 4% on unit cost, similar lead times, comparable rejection rates. Supplier A wins on price and they’ve held the contract for three years.
When the procurement team layers in sustainability data, the picture changes. Supplier A operates a coal-powered facility with emissions intensity of 1.2 tonnes of CO2 per tonne of steel. Supplier B operates a partially electric arc furnace process, emitting 0.9 tonnes of CO2 per tonne of steel. Across a 50,000-tonne annual purchase, selecting Supplier A adds 15,000 tonnes of CO2 to the OEM’s Scope 3 Category 1 (purchased goods and services) footprint.
The emissions gap has direct financial consequences:
1. Cost of capital
The OEM is in discussions with two lenders offering sustainability-linked loans with covenant structures that price down as Scope 3 intensity falls. Switching to Supplier B moves the needle on the metric determining their interest rate. Depending on the facility size, the financing benefit more than offsets the price premium of the sustainable supplier.
2. Customer contracts
Two of their largest customers have supplier sustainability scorecards embedded into their procurement criteria.The carbon intensity of the OEM's steel supply, passed through their products, affects their standing with those customers, and their ability to retain the business.
3. Future cost exposure
The OEM’s finance team has run a basic carbon price sensitivity. Under a $50/tonne carbon price - the midpoint of most regulatory forecasts for the next decade - the implied cost difference between Supplier A and Supplier B flips. What currently looks like a 4% saving may become a 12% cost exposure.
Standard spend analysis produces one answer. Spend analysis with sustainability metrics produces another, more complete one. Best-in-class teams are integrating these dimensions to their analysis.
2. From cost-centre to site of value-creation
Questions around sustainability have changed from “What’s the cost?” to “What’s the upside?”
When sustainability was primarily a reporting and compliance function, it sat on the cost side of the P&L. As it has moved from a disclosure layer to a decision layer, the question has shifted from mitigating negative externalities to identifying positive value creation opportunities.
Behind this sit several shifts:
1. The market has shifted
A strong landscape of sustainability-aligned investment programmes and industrial policies have turned climate metrics into a concrete set of opportunities for investment and innovation. Sustainability-linked financing now gives companies with strong sustainability performance access to cheaper capital. As more of these instruments enter the market, sustainability performance is becoming a factor in the cost of capital in the same way that credit ratings have long determined borrowing terms.
2. The dataset has built up
The data companies have been collecting for reporting is turning out to be operationally useful. Companies that began monitoring electricity consumption to calculate Scope 2 emissions found that it surfaced inefficiencies and flagged areas of cost reduction, along with a number of other insights across their sustainability data.
3. The upside is being documented
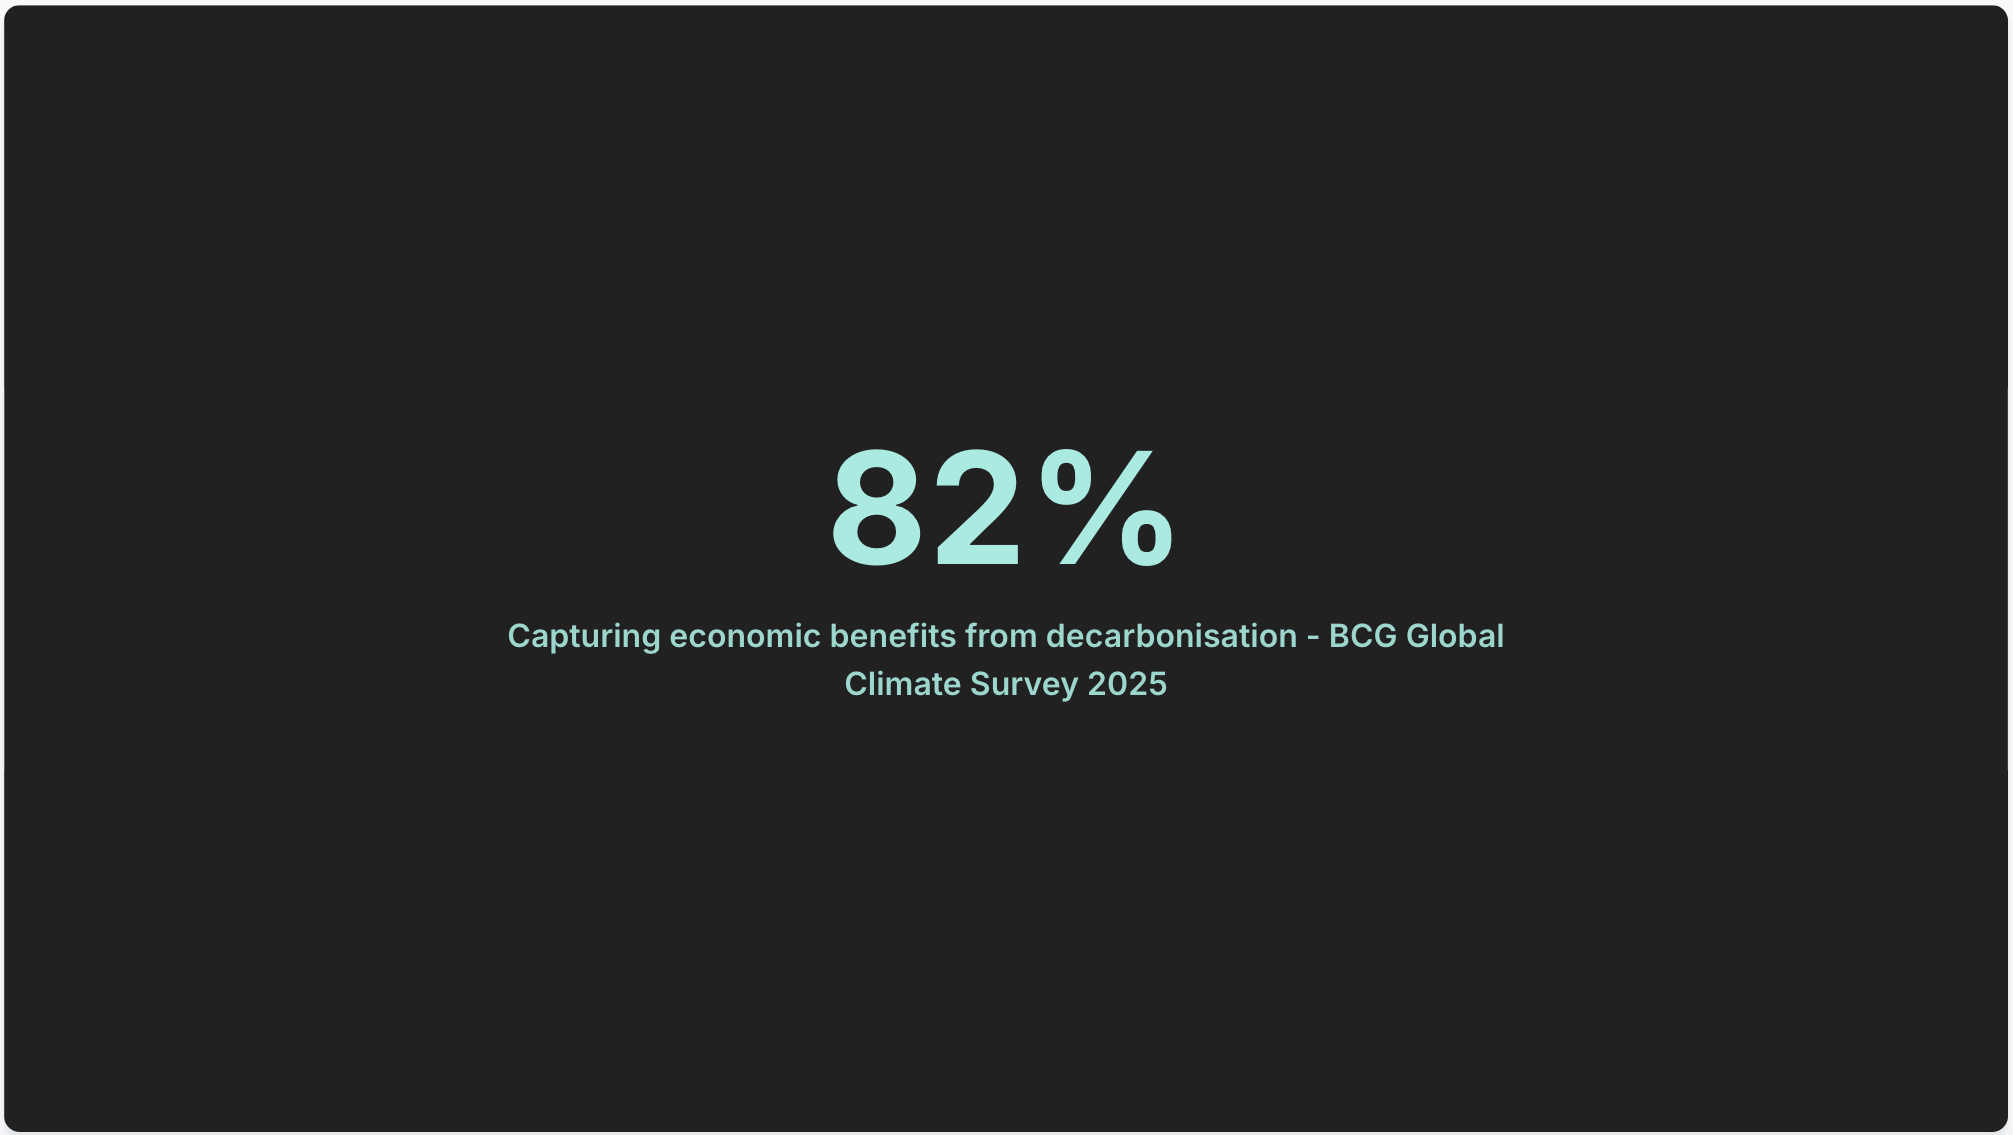
There’s several years of data on what works, making sustainability-informed decisions more predictable. Sustainability initiatives were historically considered experimental, characterised by high capital requirements and unpredictable returns for lack of measurement tools. Today, the evidence set has changed: a meta-analysis of over 2,000 empirical studies spanning four decades, confirms that robust ESG integration correlates positively with corporate financial performance in the vast majority of cases (1). Recent industry surveys have found that 82% of companies surveyed captured direct economic benefits from decarbonisation, with 6% reporting net benefits exceeding 10% of annual revenue - an average of $221M per company after costs (2).
Like any dimension of operational data that matures, sustainability data has moved from being an overhead to being an input. The teams treating it as the latter are finding it changes what they should do next: which suppliers to develop, which production processes to rethink, which financing structures to pursue. Thoughtful sustainability strategy is about accessing an advantage that competitors without the underlying data cannot reach.
3. Systematically connecting carbon to cash
Value creation pathways from sustainability strategy are only accessible if carbon performance can be translated into financial decisions.
The teams operationalising sustainability data have mapped specific pathways through which carbon performance connects to financial outcomes.
Some examples of these include:
1. Procurement
Procurement decisions are made in units such as cost per tonne, component, or SKU. For carbon data to inform these decisions, it needs to be expressed in the same way: emissions per tonne, component, or SKU. This matters because the standard approach to calculating emissions for Scope 3 Category 1 is the spend-based method, which produces category-level estimates: a calculation of the average emissions produced per dollar of spend in a product category. The OEM example in section one only works because the carbon data is at unit level: a calculation of the emissions of that particular product given its component materials and manufacturing method. This is the calculation that makes the 15,000-tonne difference between Supplier A and Supplier B visible, and makes it usable in spend analysis.
2. Production
To evaluate manufacturing processes on carbon performance, emissions must be expressed in the exact same terms as financial metrics - per unit of output, per production line, or per process step. Without that granularity, a firm can observe its total facility emissions, but it cannot isolate which specific processes are driving them, nor can it compare the carbon efficiency of two different ways of making the .To evaluate manufacturing processes on carbon performance, emissions must be expressed in the exact same terms as financial metrics - per unit of output, per production line, or per process step. Without that granularity, a firm can observe its total facility emissions, but it cannot isolate which specific processes are driving them, nor can it compare the carbon efficiency of two different ways of making the exact same thing.
Tablestakes data for best-in-class operational analysis includes sustainability data with the same granularity, latency, and auditability as their financial data.
4. The constraint is data infrastructure
The critical bottleneck for most teams attempting to access sustainability intelligence is the underlying data architecture.
Executing unit-level modelling for a large manufacturer managing 10,000 SKUs and 500 suppliers requires processing millions of data points per cycle. Spreadsheets, and software without a robust data layer, cannot process this volume and complexity. A divide emerges between “ESG Reporters” and “ESG Operators” - and the difference is often not intent but infrastructure.

Best-in-class sustainability data infrastructure differentiates itself across three dimensions:
1. Unit-based (preferably supplier-based) calculations
The Greenhouse Gas (GHG) Protocol defines a hierarchy of emission factor (EF) types, in descending order of accuracy:

Most companies start calculations at the bottom of the hierarchy, using spend-based factors because they are the easiest to apply at scale to support basic reporting mandates. But they are of limited use for operational decision-making.
Best-in-class infrastructure is designed to run unit-based calculations at scale, prioritising supplier-specific factors where available. Getting there requires a data layer capable of extracting sufficient detail from business systems to make that match possible. This typically involves four steps working in sequence:
- Data Ingestion: Automated extraction pipelines pull highly detailed activity data from ERPs and source systems - specific invoice line items, material weights, logistics routes, energy consumption records. This detail is what enables the activity to be matched to a precise EF.
- Transformation, Enrichment, Validation: Data processing pipelines take raw operational data, which is often messy and incomplete, and normalises it into a shared data model, validates each data point, and enriches where source data is insufficient. Enrichment tools, in particular, such as routing algorithms, material composition databases, facility-level energy records, can surface the unit-based detail that is implied in source data but not explicitly recorded. This step is what makes higher-quality emission factor matching achievable in practice.
- Automated Emission Factor Matching: Once ingested and enriched, algorithmic matching workflows pair each activity data point with the most accurate available emission factor, working down the GHG Protocol hierarchy from supplier-specific to spend-based, using the best available data for each individual record. This needs to be automated to operate at the data volumes involved, and reviewed by human experts to validate that the overall matching process has succeeded and that the emission factor database remains current.
- Curation: Automated systems handle the majority of data reliably. The remainder, such as suppliers that don't map cleanly to standard extraction patterns, product lines requiring bespoke calculation approaches, requires human expert input to identify where better data can be collected and how. This curation layer is what continuously improves the quality of the output over time.
2. Live data
With operational decisions made throughout the year, decision latency - the delay between when useful information exists and the company acts on it - matters.
Best-in-class data infrastructure updates sustainability metrics daily, as new data becomes available in source systems. This capability requires data pipelines that run daily checks to source systems, and on detecting new data, automatically runs the extraction, transformation, enrichment, and calculation workflows.
3. Surfacing the signal
With a large volume of data at hand, interfaces with the data need to surface the key signals, and allow teams to explore the underlying drivers.
Best-in-class interfaces combine standard metrics, to establish a baseline for compliance and market comparison, with custom metrics, mapped to the company's particular business structure — its procurement categories, supplier relationships, and production processes. These frameworks are supported by data automation and curation:
- Automation (Data Foundation and Frameworks): Automated pipelines produce a data set with sufficient granularity to support insightful KPIs, then plug the data into the set of predefined frameworks, ensuring metrics are live and consistent as new data flows in.
- Curation: In initial set up, through ongoing reviews of the data, human curation defines which metrics are worth tracking and refines them as the business evolves.
Once defined, each metric should be drill-able, so the team can move from a high-level signal down through the layers driving it: which category, which supplier, which invoice line item. That drill-ability is what separates a dashboard from a decision-making tool.
Teams with this infrastructure at hand can easily add sustainability as a dimension to their operational strategy.
5. The early movers win
When a new dimension of operational data becomes critical, the companies that build the relevant data infrastructure first capture the advantage.
The pattern plays across innovation cycles. When global transaction volumes scaled in the 1980s and 1990s, the introduction of Enterprise Resource Planning (ERP) systems allowed firms to transition from fragmented, retrospective reporting to a holistic informative view of inventory, procurement, and production. Finance moved from being a month-end reporting function, to a strategic discipline, focused on driving better use of cash and capital. The companies that adopted early had better information than their competitors while others were still building toward that baseline. By the time ERP was standard, the advantage had moved on.
The early adopters of operational sustainability infrastructure are capturing similar advantages, through mechanisms such as:
- Capital Access: Early adopters are currently securing access to cheaper, sustainability-oriented capital while these financial instruments still reward differentiation. As more firms eventually qualify for sustainability-linked loans and mandatory regulations standardize baseline compliance, lenders will begin treating these sustainability features as standard, causing the initial pricing edge to narrow and commoditise.
- Strategic Capital Allocation: Teams with robust sustainability data infrastructure are operating with a more complete picture of their cost base, supplier risk, and capital options than competitors running category-level estimates. They can identify which supplier relationships to develop before those suppliers become contested, which production processes carry hidden cost exposure under future carbon pricing, and which financing structures to pursue while terms are favourable.
Teams with sustainability infrastructure are capturing the benefits of a new dimension of best-in-class operational performance.
Sources
- Friede, G., Busch, T., & Bassen, A. (2015). ESG and financial performance: aggregated evidence from more than 2000 empirical studies. Journal of Sustainable Finance & Investment, 5(4), 210–233. https://doi.org/10.1080/20430795.2015.1118917
- Dimitrova, D. et al. (2025) How companies are tackling the climate challenge-and creating value, BCG Global. Available at: https://www.bcg.com/publications/2025/tackling-climate-challenge-creating-value
- Technical guidance for Calculating Scope 3 emissions. Available at: https://ghgprotocol.org/sites/default/files/standards/Scope3_Calculation_Guidance_0.pdf
.png)


.png)

.png)

